Upload your BED file(s)
Note: All input files should provide genomic regions in BED file format corresponding to appropriate species genome versions.
About UniBind TFBS sets enrichment
The UniBind enrichment tool predicts which sets of TFBSs from the UniBind database are enriched in a set of given genomic regions. Enrichment computations are performed using the LOLA tool. For more information about the underlying enrichment computations, read the LOLA documentation. The underlying database of TFBS sets from UniBind in provided as RDS files in our Zenodo repository, which have been precomputed using LOLA. The tool allows for three types of computations:
- Enrichment of TFBSs in a set of genomic regions compared to a given universe of genomic regions.
- Differential TFBS enrichment when comparing one set of genomic regions (set1) to another (set2).
- Enrichment of TFBSs in a set of genomic regions compared to all TFBS sets stored in UniBind.
1. Enrichment within a given universe of genomic regions
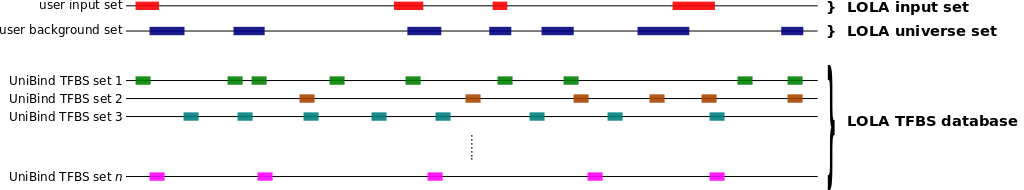
To compute which sets of TFBSs from UniBind are enriched in a set S of genomic regions compared to a universe U of genomic regions, you can use the oneSetBg subcommand as follows.
bash bin/UniBind_enrich.sh oneSetBg <LOLA db> <S bed> <U bed> <output dir>
This will compute the enrichment of TFBS sets from UniBind
(using data/20190423_UniBind_LOLA.RDS) in the genomic
regions from S (provided as a BED file) when compared to
the expectation from a universe U of genomic regions
(provided as a BED file). All result files will be provided in
the <output dir> directory. Note that every
region in S should overlap with one region in
U.
2. Differential enrichment
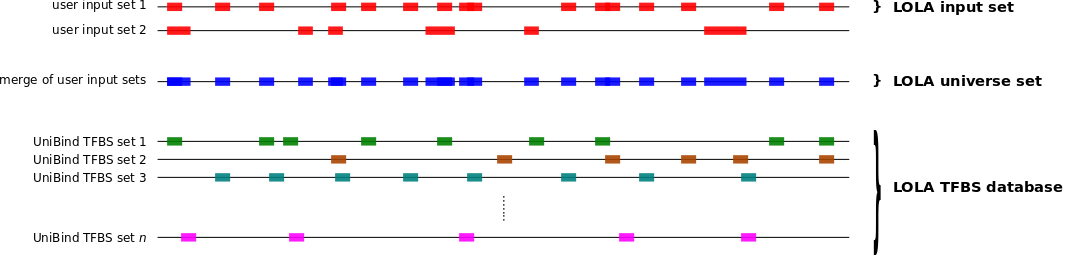
To compute which sets of TFBSs from UniBind are enriched in a set S1 of genomic regions compared to another set S2 of genomic regions, you can use the twoSets subcommand as follows.
bash bin/UniBind_enrich.sh twoSets <LOLA db> <S1 bed> <S2 bed> <output dir>
This will compute the enrichment of TFBS sets from UniBind (using
data/20190423_UniBind_LOLA.RDS) in the genomic regions from
S1 (provided as a BED file) when compared to the genomic
regions in S2 (provided as a BED file). All result files will
be provided in the <output dir> directory.
3. Enrichment when no background is provided
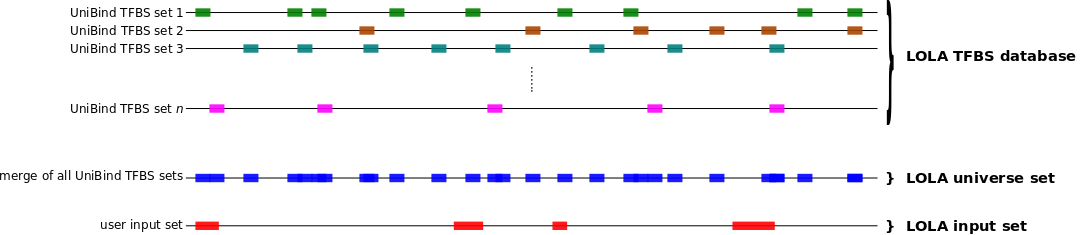
When no background is provided, one can compute which sets of TFBSs from UniBind are enriched in a set S of genomic regions using the oneSetNoBg subcommand as follows. In this case, the enrichment will be computed against a default background corresponding to the genomic regions of all TFBSs stored in UniBind. WARNING We encourage users to provide an adequate background set of genomic regions whenever possible using the oneSetBg subcommand.
bash bin/UniBind_enrich.sh oneSetNoBg <LOLA db> <LOLA universe> <S bed> <output dir>
This will compute the enrichment of TFBS sets from UniBind (using
data/20190423_UniBind_LOLA.RDS and
data/20190423_UniBind_LOLAuniverse.RDS) in the genomic regions
from S (provided as a BED file). All result files will be
provided in the <output dir> directory.
UniBind enrichment output and example
Output
The output directory will contain the allEnrichments.tsv
file provide the enrichment score for each TFBS set from UniBind along
with their metadata information. Similar files (following the template
col_
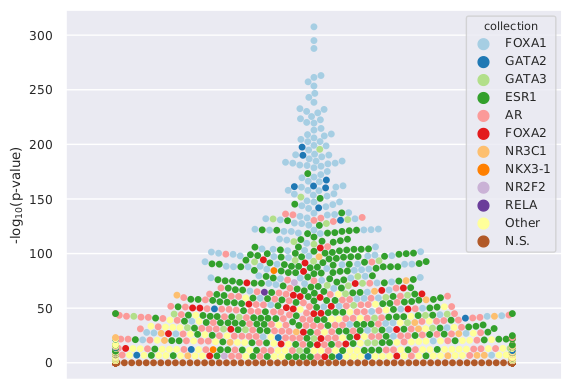
A visual representation of the enrichment analysis is provided in the output directory in the plot file allEnrichments_swarm.pdf. It corresponds to a swarm plot using the log10(p-value) of the enrichment for each TFBS set on the y-axis. The data sets for the top 10 TFs showing a log10(p-value)<2 are highlighted with dedicated colors (one color per TF). Data sets with log10(p-value)>2 are provided with a color for N.S. (non-significant).
Example
As an example of application, we provide data derived from the publication DNA methylation at enhancers identifies distinct breast cancer lineages, Fleischer, Tekpli, et al, Nature Communications, 2017. The genomic regions of interest correspond to 200bp-long regions around CpGs from cluster 2A described in the publication. These regions around CpGs of interest are shown to be associated with FOXA1, GATA, and ESR1 binding. We applied the following command to compute TFBS enrichment using all the CpG probes from the Illumina Infinium HumanMethylation450 microarray:
bash bin/UniBind_enrich.sh oneSetBg data/20190423_UniBind_LOLAdb.RDS data/example_Fleischer_et_al/clusterA_200bp_hg38.bed data/example_Fleischer_et_al/450k_probes_hg38_200bp.bed ub_enrichment
We observe a clear enrichment for TFBSs associated with the expected TFs. The corresponding swarm plot is: